


Editor's Picks


Shop Spring Favorites

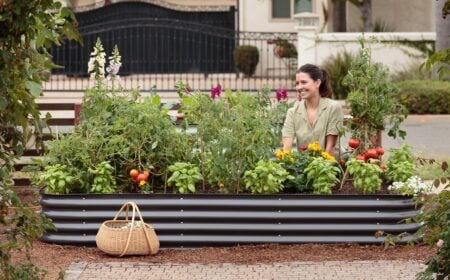
Sale
15" Short Birdies Large Modular Raised Garden Bed
From 169.99 USD
In Stock
Buy Now
Sale
29” Tall Birdies Medium Modular Raised Garden Bed
From 189.99 USD
In Stock
Buy Now
Sale
29” Tall Birdies Small Modular Raised Garden Bed
From 169.99 USD
In Stock
Buy Now
Fiesta Blend Nasturtium Seeds
From 3.49 USD
In Stock
Buy Now
Gold Rush Bush Bean Seeds
From 2.99 USD
In Stock
Buy Now
Heirloom Organic Seed Bank Collection
From 74.99 USD
In Stock
Buy Now
Persian Carpet Zinnia Seeds
From 2.69 USD
In Stock
Buy NowFEATURED READS
Seeds
Looking to get your seeds started indoors or direct sown the right way? Find out all you need to know about starting seeds in these comprehensive guides!


Vegetables
Trying to figure out which leafy greens to add to your garden this season? Check out these detailed growing guides that can help!


Product Reviews
Looking for gardening product reviews? We review the best gear for your gardening needs, including tools, greenhouses, and more.


Latest Posts

How to Plant, Grow, and Care for Cleome Flowers
Despite its glamorous and fantastical flowers, this plant is exceptionally easy to grow! Gardening expert Lindsay Miller explains how to grow and care for this beautiful flower in your garden.

27 Low-Maintenance Perennial Plants for Home Landscapes
Perennials anchor the garden, embellishing the display year after year with color and textural interest that gets bigger and better with age. Harmonizing in groups or easily moved and divided to expand the collection, their outstanding flowers and foliage bring beauty and ecological value to the display. Rely on tried-and-true perennials to do the heavy lifting with little gardener effort. With the right arrangement and cultural conditions, low-maintenance perennials serve the garden in longevity. Explore superior perennials whose rugged nature belies their beauty with gardening expert Katherine Rowe.

How to Propagate Agave From Leaf Cuttings
Stunningly sculptural, agave plants bring bold architectural elements to the landscape and garden. But can you propagate them from leaf cuttings like other succulents? Gardening Expert Melissa Strauss will walk you through propagation of agave using leaf cuttings, and discuss some other methods, too!

19 Best Raised Bed Garden Plants for Hot Climates
Not sure which raised bed plants can beat the heat? Whether you’re in a hot climate zone or just notice that your area is subject to more and more heat waves each year, planning raised beds around high temps is a good idea. Plant biologist Emily Estep will walk you through some solid choices for raised bed garden plants in hot climates.

7 Ways to Turn Your Compost Pile
Compost piles are excellent for backyard gardeners who want to save money on soil amendments or upcycle excess waste. Turning piles speeds up decomposition, lets microbes breathe, and keeps rotting smells at bay. Join longtime composter Jerad Bryant and discover seven easy ways to turn your compost piles.

21 Wildflowers Native to Washington State
Washington wildflowers provide floral beauty while feeding pollinators, birds, and mammals. They’re perfect substitutes for weak, nonnative ornamentals that struggle during cold winters or dry summers. Discover the best ones for your backyard ecosystem alongside native plant gardener Jerad Bryant.

A Comprehensive Guide to Rose Propagation
One rose is never enough, although it is enough to make more roses! Propagate new shrubs from old ones through seeds, cuttings, layering, or division. Join native plant gardener Jerad Bryant in turning one rose into many.

11 Ways You Can Help Reverse Insect Decline in Your Garden
Insect decline may seem like a good thing (less mosquitoes and pests, right?) but it is actually a major threat to our ecosystems. Over 97% of insects are beneficial, but we are losing them at a rapid rate. In this article, former organic farmer Logan Hailey explains simple ways to welcome “good guy” insects into your garden, increasing biodiversity and ecosystem services.

How to Plant, Grow, and Care for Flowering Maple Shrubs
Indoors? Outdoors? Containers? Beds? Hanging baskets? Where can’t you plant a flowering maple? In this article, gardening enthusiast Lindsay Miller details how to grow and care for this versatile tropical shrub.

19 Garden Plants That Will Grow in Sun or Shade
Garden transition zones often call for plants that span sunny and shady conditions. Short of full sun to deep shade, options abound to bridge areas with varying exposures. Certain species and varieties fit sun and shade circumstances depending on your growing area and climate (including sun and heat intensity). Explore plant selections to bridge light conditions with gardening expert Katherine Rowe.

21 Garden Plants With Pink Leaves
Depending on the tone, pink foliage has the power to calm and unify or ignite and enliven the planting display. From chaotic magenta brushes to light blush tinges, pink leaves create striking visual interest among other leafy greens and flowering specimens. Join gardening expert Katherine Rowe in exploring garden plants in the prettiest of pinks.

How to Plant, Grow, and Care for Weld: A Natural Yellow Dye Plant
Are you interested in creating vibrant yellow natural dyes? Then consider growing weld! Farmer Briana Yablonski shares how to plant and care for this flowering plant.